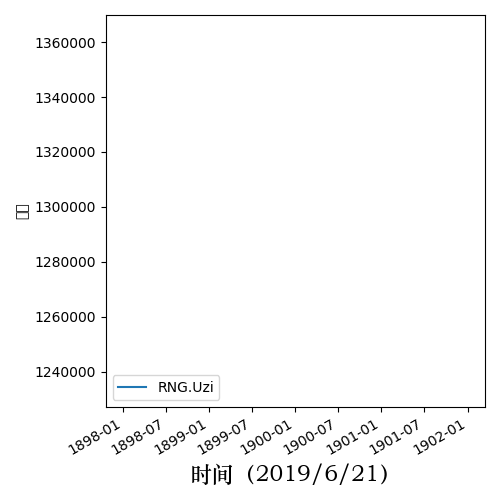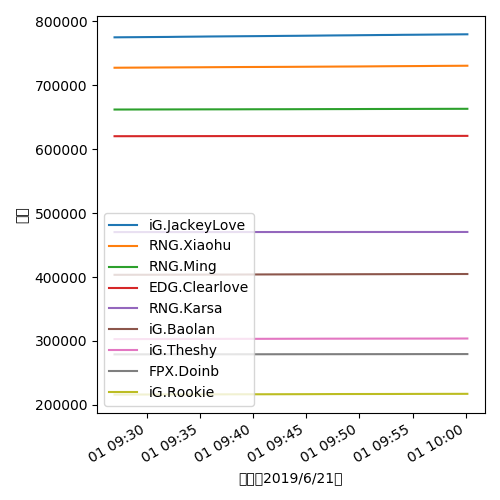
在使用Matplotlab绘制图表时,如果标签中包含中文,会显示初方块,这是因为默认的字体中没有包含中文。
可以在代码中手动指定字体:
import matplotlib.pyplot as plt
plt.rcParams['font.sans-serif'] = ['STZhongsong']
STZhongsong(华文中宋)即是我们所指定的支持中文的字体。你可以使用自己喜欢的字体。
在C:\Users\[用户名]\.matplotlib\fontlist-v310.json中,可以看到所有可用的字体,每一块的name字段就是要填写的字体名称。
...
    {
      "fname": "fonts\\ttf\\STIXNonUniBolIta.ttf",
      "name": "STIXNonUnicode",
      "style": "italic",
      "variant": "normal",
      "weight": "bold",
      "stretch": "normal",
      "size": "scalable",
      "__class__": "FontEntry"
    },
...
Why it works?
在pyplot的rcParam中存储了一些默认的配置:
>>> import matplotlib.pyplot as plt
>>> plt.rcParams
RcParams({'_internal.classic_mode': False,
           'agg.path.chunksize': 0,
           'animation.avconv_args': [],
           'animation.avconv_path': 'avconv',
           'animation.bitrate': -1,
           'animation.codec': 'h264',
           'animation.convert_args': [],
           'animation.convert_path': 'convert',
           'animation.embed_limit': 20.0,
           ...
          })
在font.family字段制定了使用的字体集,默认地,是sans-serif(等宽字体),mathplotlab会使用font.sans-serif中包含的字体:
>>> import matplotlib.pyplot as plt
>>> plt.rcParams['font.family']
 ['sans-serif']
 plt.rcParams['font.sans-serif']
 ['DejaVu Sans', 'Bitstream Vera Sans', 'Computer Modern Sans Serif', 'Lucida Grande', 'Verdana', 'Geneva', 'Lucid', 'Arial', 'Helvetica', 'Avant Garde', 'sans-serif']
前文中的方法,就是将指定的font.sans-serif字段中包含的字体改成只有STZhongsong一个字体,以限制pyplot只使用这一种字体,是中文正常显示。
虽然起了作用,但这并不是一种合适的方法,首先修改的是默认配置,这个稍后再谈,其次是“混淆”地让pyplot假装使用了sans-serif。
查阅官方文档关于此处的说法(https://matplotlib.org/3.1.0/api/_as_gen/matplotlib.pyplot.rc.html#matplotlib.pyplot.rc),可以看到应当使用以下方式设置默认字体:
import matplotlib.pyplot as plt
font = {'family' : 'STZhongsong',  # 字体名
        'weight' : 'light',        # 字体粗细
        'size'   : 16}             # 字体大小(实测只接受数字)

plt.rc('font', **font)
font字典的形式和 fontlist-v310.json 是一样的。测试后可以看到,效果相同,但是这样就自然了很多。

这样是设置默认字体才完成的,自然也可以在绘图时设置字体。
pyplot中,凡是需要显示文字的函数都接受一个可选参数fontdict,以xlabel为例:
matplotlib.pyplot.xlabel(xlabel, fontdict=None, labelpad=None, **kwargs)
向其中传入fontdict,我只传给了xlabel,与ylabel做一个对比:
...
font = {'family' : 'STZhongsong',
'weight' : 122,
'size' : 16}
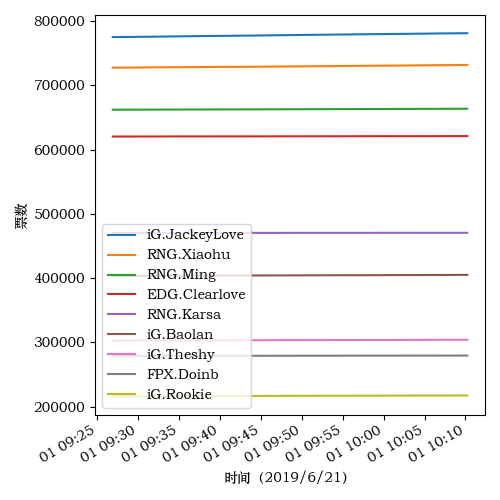
plt.xlabel("时间(2019/6/21)", font)
plt.ylabel("票数")
...
如图,x轴上的标签可以显示中文了: